set term postscript eps enhanced options
where options can be color, solid and/or dashed (only in the newest versions). The font and size used in all labels can be controlled here using: font "FONT, size" .
gnuplog
Wednesday, September 5, 2012
Graphic output: "eps"
Most of the scientific journals asks for figures in "eps" (encapsuled postscript) to publish a paper. The option in gnuplot is:
Labels in two lines
If the axis label is too long and you need to split it in two lines, you should write \n in the breaking point.
Wednesday, August 29, 2012
References in Latex: entry types
When creating the bibliography file of your Latex document (whatever.bib), you can reference several kinds of document. Here you will find a description of them.
Monday, September 19, 2011
Colours and formats
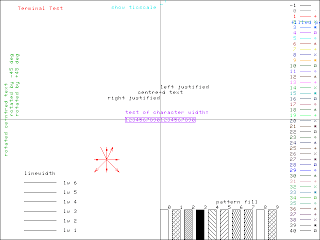
It is a difficult task to control colours in GNUPLOT. Each type of output file (png, ps, eps, etc.) has its own colour definition. In order to know which colour belongs to each line style, an easy method is to type test after selecting the output format.
Example:
Example:
- set term png
- set output 'test_colour.png'
- test
Then, the file test_colour.png will look like:

This can be done for all output formats (png, ps, eps...).
Friday, September 2, 2011
Palettes
There are several methods for defining a colour palette in GNUPLOT. Here one of them is presented and explained in a simple way. If you want to go deep into this topic, you will have to look for more extensive references (some of them listed as useful links).
First of all, we need to define the number of colours that our palette will contain using this command:
Then, what we have to do is to specify the colour of each part of the palette using the following command:
Example (A):
We can specify as much colours as we want, for example (B):
As a final example, if we want to ascribe a specific colour to the middle value of the palette (in order, for instance, to separate positive and negative values), we will have to write something like this (C):
First of all, we need to define the number of colours that our palette will contain using this command:
- set palette maxcolors <number>
Then, what we have to do is to specify the colour of each part of the palette using the following command:
- set palette defined (<position1> "<colour1>", <position2> "<colour2>", ...)
Example (A):
- set palette maxcolors 100
- set palette defined (0 "red", 99 "blue")
We can specify as much colours as we want, for example (B):
- set palette maxcolors 1000
- set palette defined (\
- 0 "red", \
- 249 "yellow", \
- 749 "green", \
- 999 "blue")
As a final example, if we want to ascribe a specific colour to the middle value of the palette (in order, for instance, to separate positive and negative values), we will have to write something like this (C):
- set palette maxcolors 4001
- set palette defined (\
- 0 "red", \
- 1000 "orange", \
- 1600 "dark-yellow", \
- 1999 "yellow", \
- 2000 "grey", \
- 2001 "green", \
- 2400 "dark-green", \
- 3000 "cyan", \
- 4000 "blue")
Caution: The palettes presented here work in eps output files. If you work with other types of file, you may have some troubles with the colours.
Thursday, September 1, 2011
Converting eps to png
Although this post is not dedicated to GNUPLOT, it can be useful for those working with image files. If you have tried to use the Linux command convert with eps files, you will have found that it usually ends in a dramatic reduction in the resolution of your figures, i.e. the next command does not work properly:
Example:
- convert whatever.eps whatever.png
- convert -density <density> whatever.eps whatever.png
Example:
- convert -density 200 whatever.eps whatever.png
Subscribe to:
Comments (Atom)
