Showing posts with label plotting. Show all posts

Monday, September 19, 2011

Colours and formats

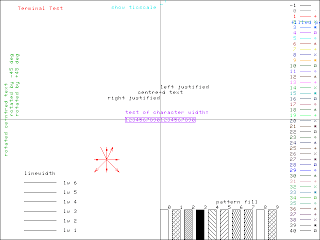
It is a difficult task to control colours in GNUPLOT. Each type of output file (png, ps, eps, etc.) has its own colour definition. In order to know which colour belongs to each line style, an easy method is to type test after selecting the output format.

Example:
  • set term png
  • set output 'test_colour.png'
  • test

Then, the file test_colour.png will look like:

This can be done for all output formats (png, ps, eps...).

Friday, September 2, 2011

Palettes

There are several methods for defining a colour palette in GNUPLOT. Here one of them is presented and explained in a simple way. If you want to go deep into this topic, you will have to look for more extensive references (some of them listed as useful links).

First of all, we need to define the number of colours that our palette will contain using this command:
  • set palette maxcolors <number>

Then, what we have to do is to specify the colour of each part of the palette using the following command:
  • set palette defined (<position1> "<colour1>", <position2> "<colour2>", ...)

Example (A):
  • set palette maxcolors 100
  • set palette defined (0 "red", 99 "blue")
These lines will create a palette of 100 colours from red (position 0) to blue (position 99). Between both positions, GNUPLOT will perform a gradation.

We can specify as much colours as we want, for example (B):
  • set palette maxcolors 1000
  • set palette defined (\
  • 0 "red", \
  • 249 "yellow", \
  • 749 "green", \ 
  • 999 "blue")

As a final example, if we want to ascribe a specific colour to the middle value of the palette (in order, for instance, to separate positive and negative values), we will have to write something like this (C):
  • set palette maxcolors 4001
  • set palette defined (\
  • 0 "red", \
  • 1000 "orange", \
  • 1600 "dark-yellow", \
  • 1999 "yellow", \
  • 2000 "grey", \
  • 2001 "green", \
  • 2400 "dark-green", \
  • 3000 "cyan", \
  • 4000 "blue")
Note that only the value in the middle corresponds to gray. The previous and the following values (with a precision that depends on the number of colours selected) will correspond to yellow and green respectively.

Caution: The palettes presented here work in eps output files. If you work with other types of file, you may have some troubles with the colours.

Monday, July 11, 2011

Rotating axes labels

The command to rotate the labels in one of the axis is:
  • set <axis>tic rotate by <angle> scale <size>
The parameter scale must be a number and accounts for the size of the tics in the selected axis.
Example:
  • set xtic rotate by 90 scale 0.5
Caution: Be careful when rotating an angle non multiple of 90 because it can lead to non desired effects.

Tuesday, July 5, 2011

Working with the columns of the data file

This post talks about how to control the information about the columns in a data file.

1) Once we want to plot the data contained in a data file, we can just write:
  • plot 'whatever.dat'
This will take the first column of the data file as the X coordinate and the second column as the Y coordinate.

2) In order to specify which column corresponds to each coordinate, we can write, for instance:
  • plot 'whatever.dat' u 3:2
It will take the data in the third column as the X coordinate and the data in the second column as the Y coordinate.

3) We can also treat any of the columns as a variable (previously defined):
  • COL=2
  • plot 'whatever.dat' u 3:COL

4) In order to perform mathematic operations to the number of any column, we must use parentheses:
  • COL=3
  • plot 'whatever.dat' u COL:(COL-1)

5) Nevertheless, if we want to operate the values contained in the column (not the number of the column), we have to use the dollar sign:
  • plot 'whatever.dat' u (cos($3)):5

6) Finally, if we want to perform the mathematic operation to the value of a column specified with a variable, we will have to use the function column:
  • COL=3
  • plot 'whatever.dat' u (cos(column(COL))):5